top of page
Project Portfolio
The maps shown here represent a sample of my GIS work from my projects at school, Portland Community College. A later phase of this portfolio will show recent work I have done on my own time in QGIS, as well as more samples of my college work.
I want to note, that I cannot shown any samples of my work from NV5, so that I may be compliant with my NDA and proprietary data agreements.
Umatilla County Jobs Accessibility by Transit
A Network Walk-shed Analysis of Transit Routes Intersecting a Spatial Analysis of Job Destinations
Capstone Project, in completion of Geo 267 at PCC, 2020
Not optimized for view on a mobile device, I'm sorry. I did try to.

01
Umatilla County Transit Routes
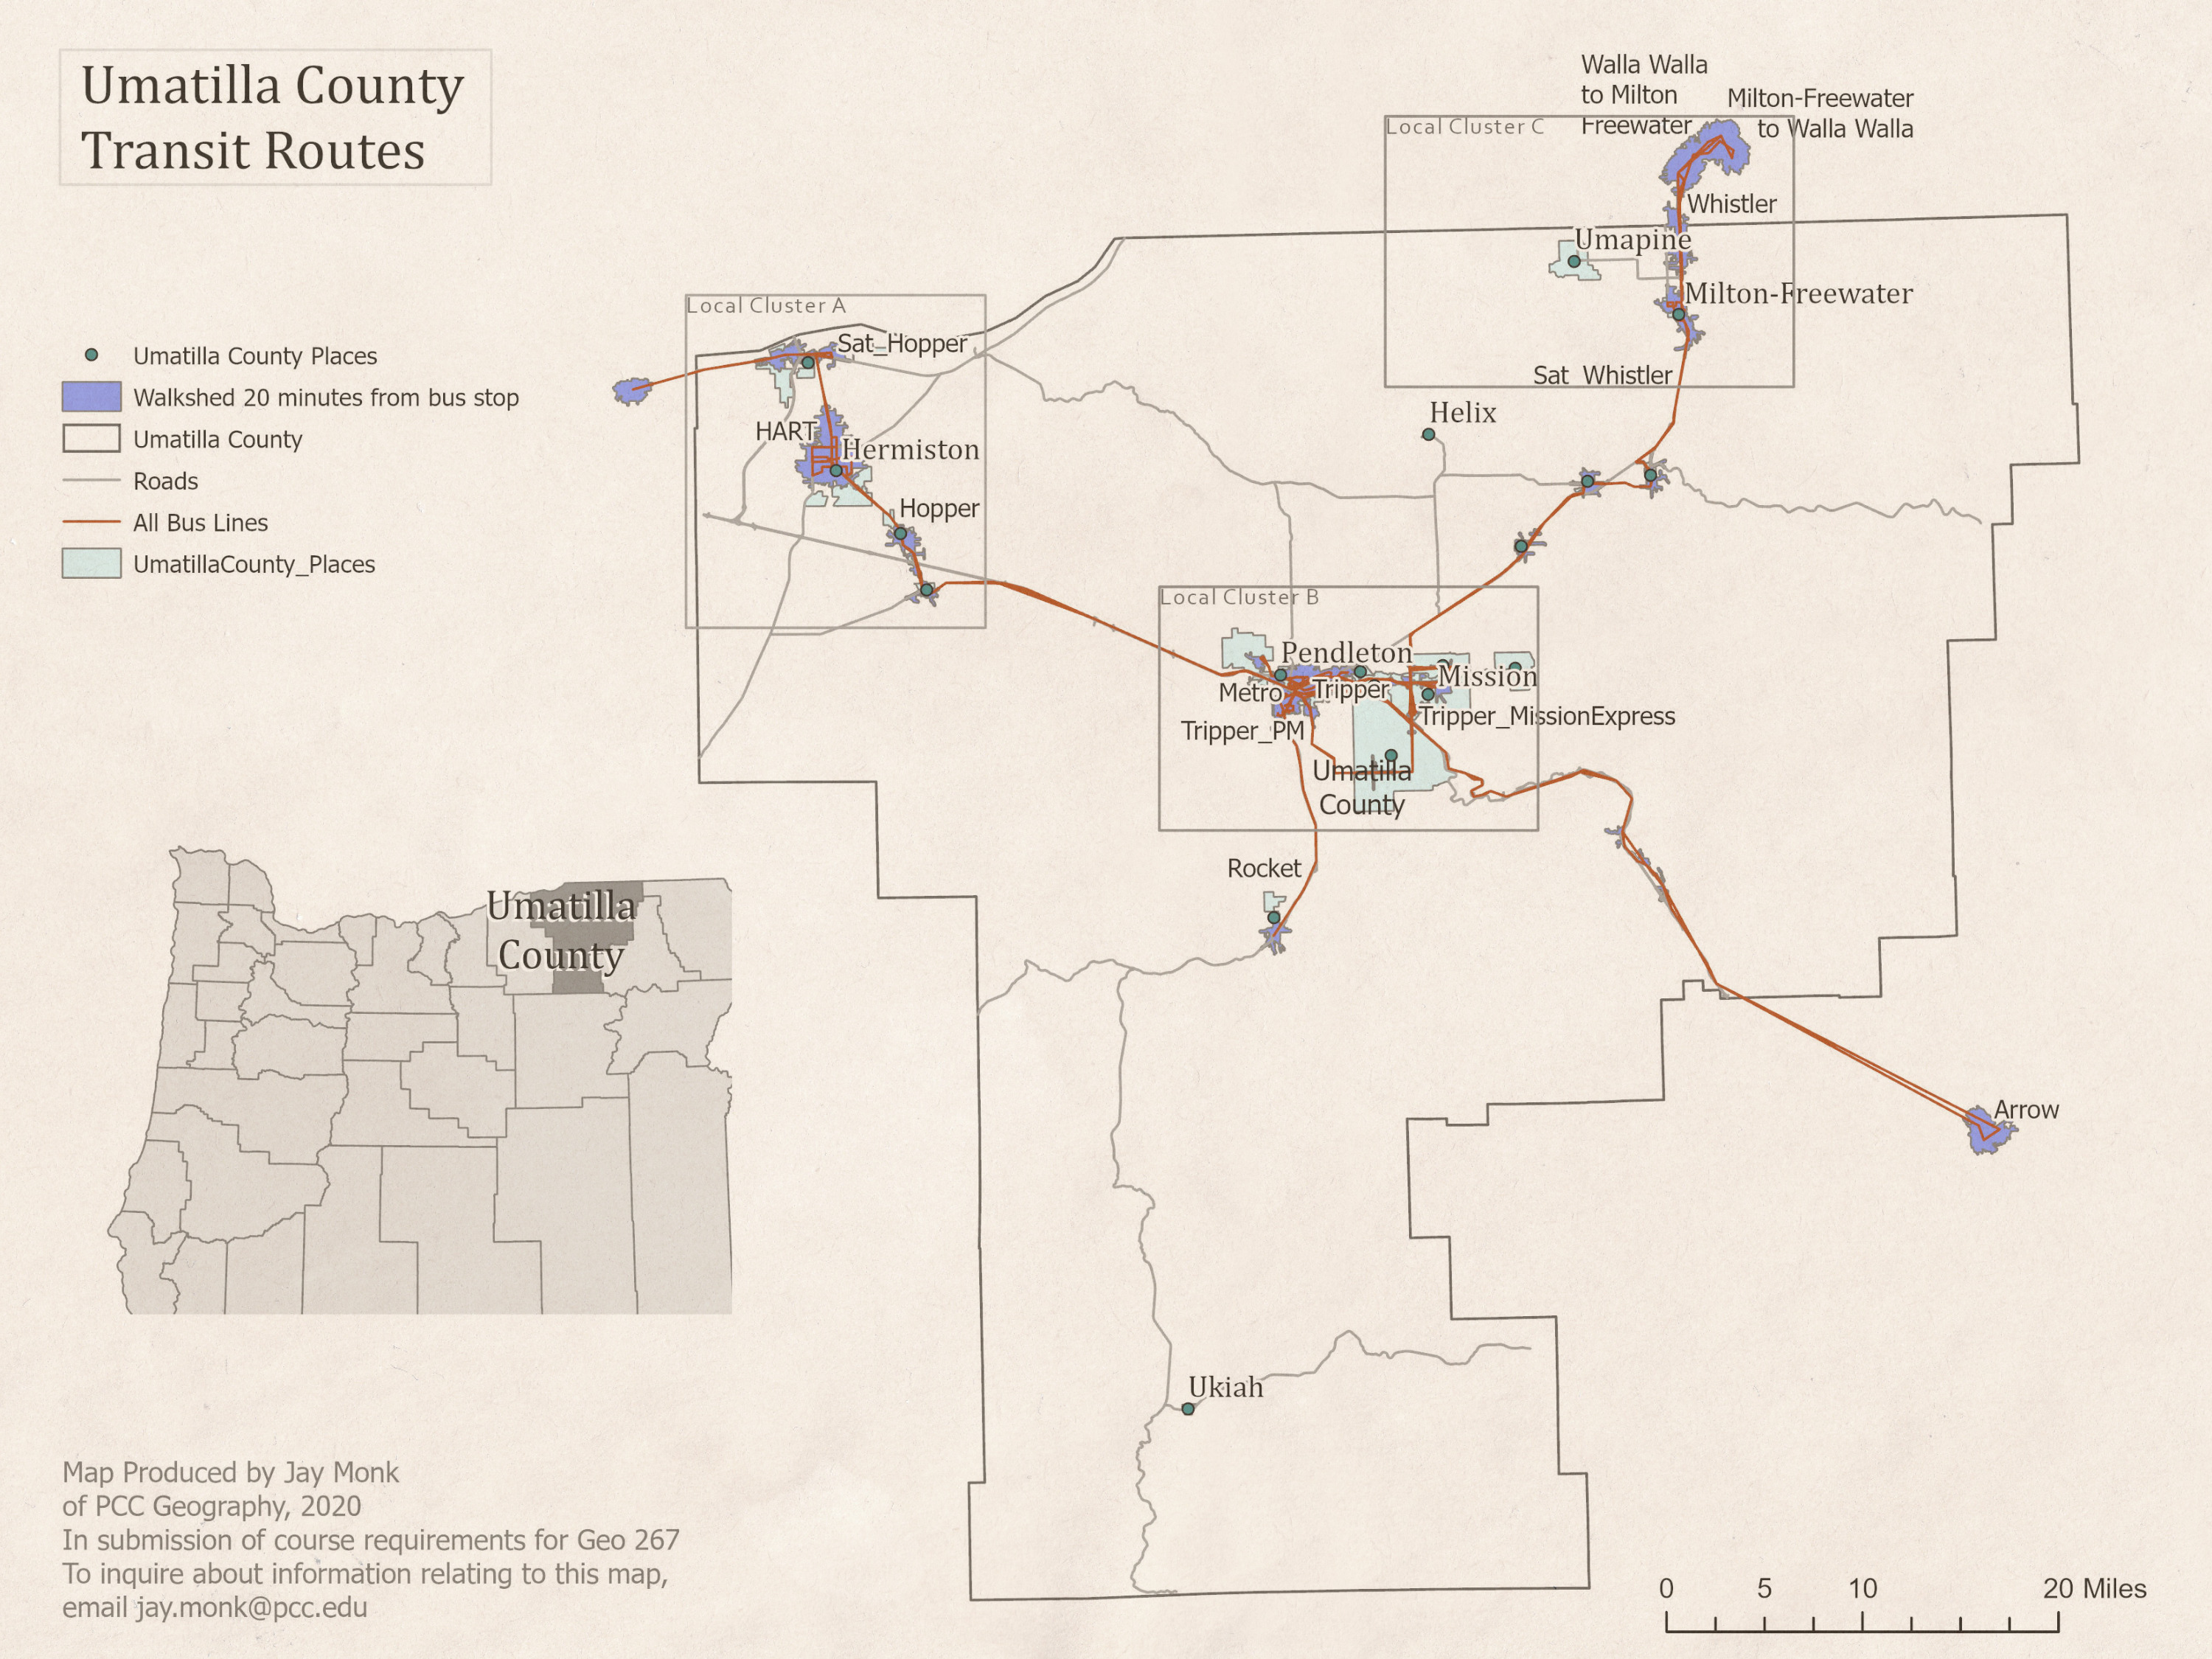
Capstone project for my GIS certificate at Portland Community College. Produced in 2020, in partnership with the Oregon Environmental Council. These maps show the intersection of two analyses: a Network Walkshed Analysis on 20 minutes walking time from transit stops and a Spatial Proximity Analysis on job locations. For these analyses, I used the county limits of Umatilla to define the whole area of interest, and Census Designated Places (CDPs) to define the “inside” and “outside” of the walkshed and spatial analysis parameters. The overall purpose for these analyses was to inquire into the topic of study for my project non-profit partner, The Oregon Environmental Council, studying the question: Where are the jobs within a 20-minute walking time of a bus stop, in Umatilla County?
The data for this analysis was current as of 2020.

02
Job Destinations in Umatilla County, Oregon
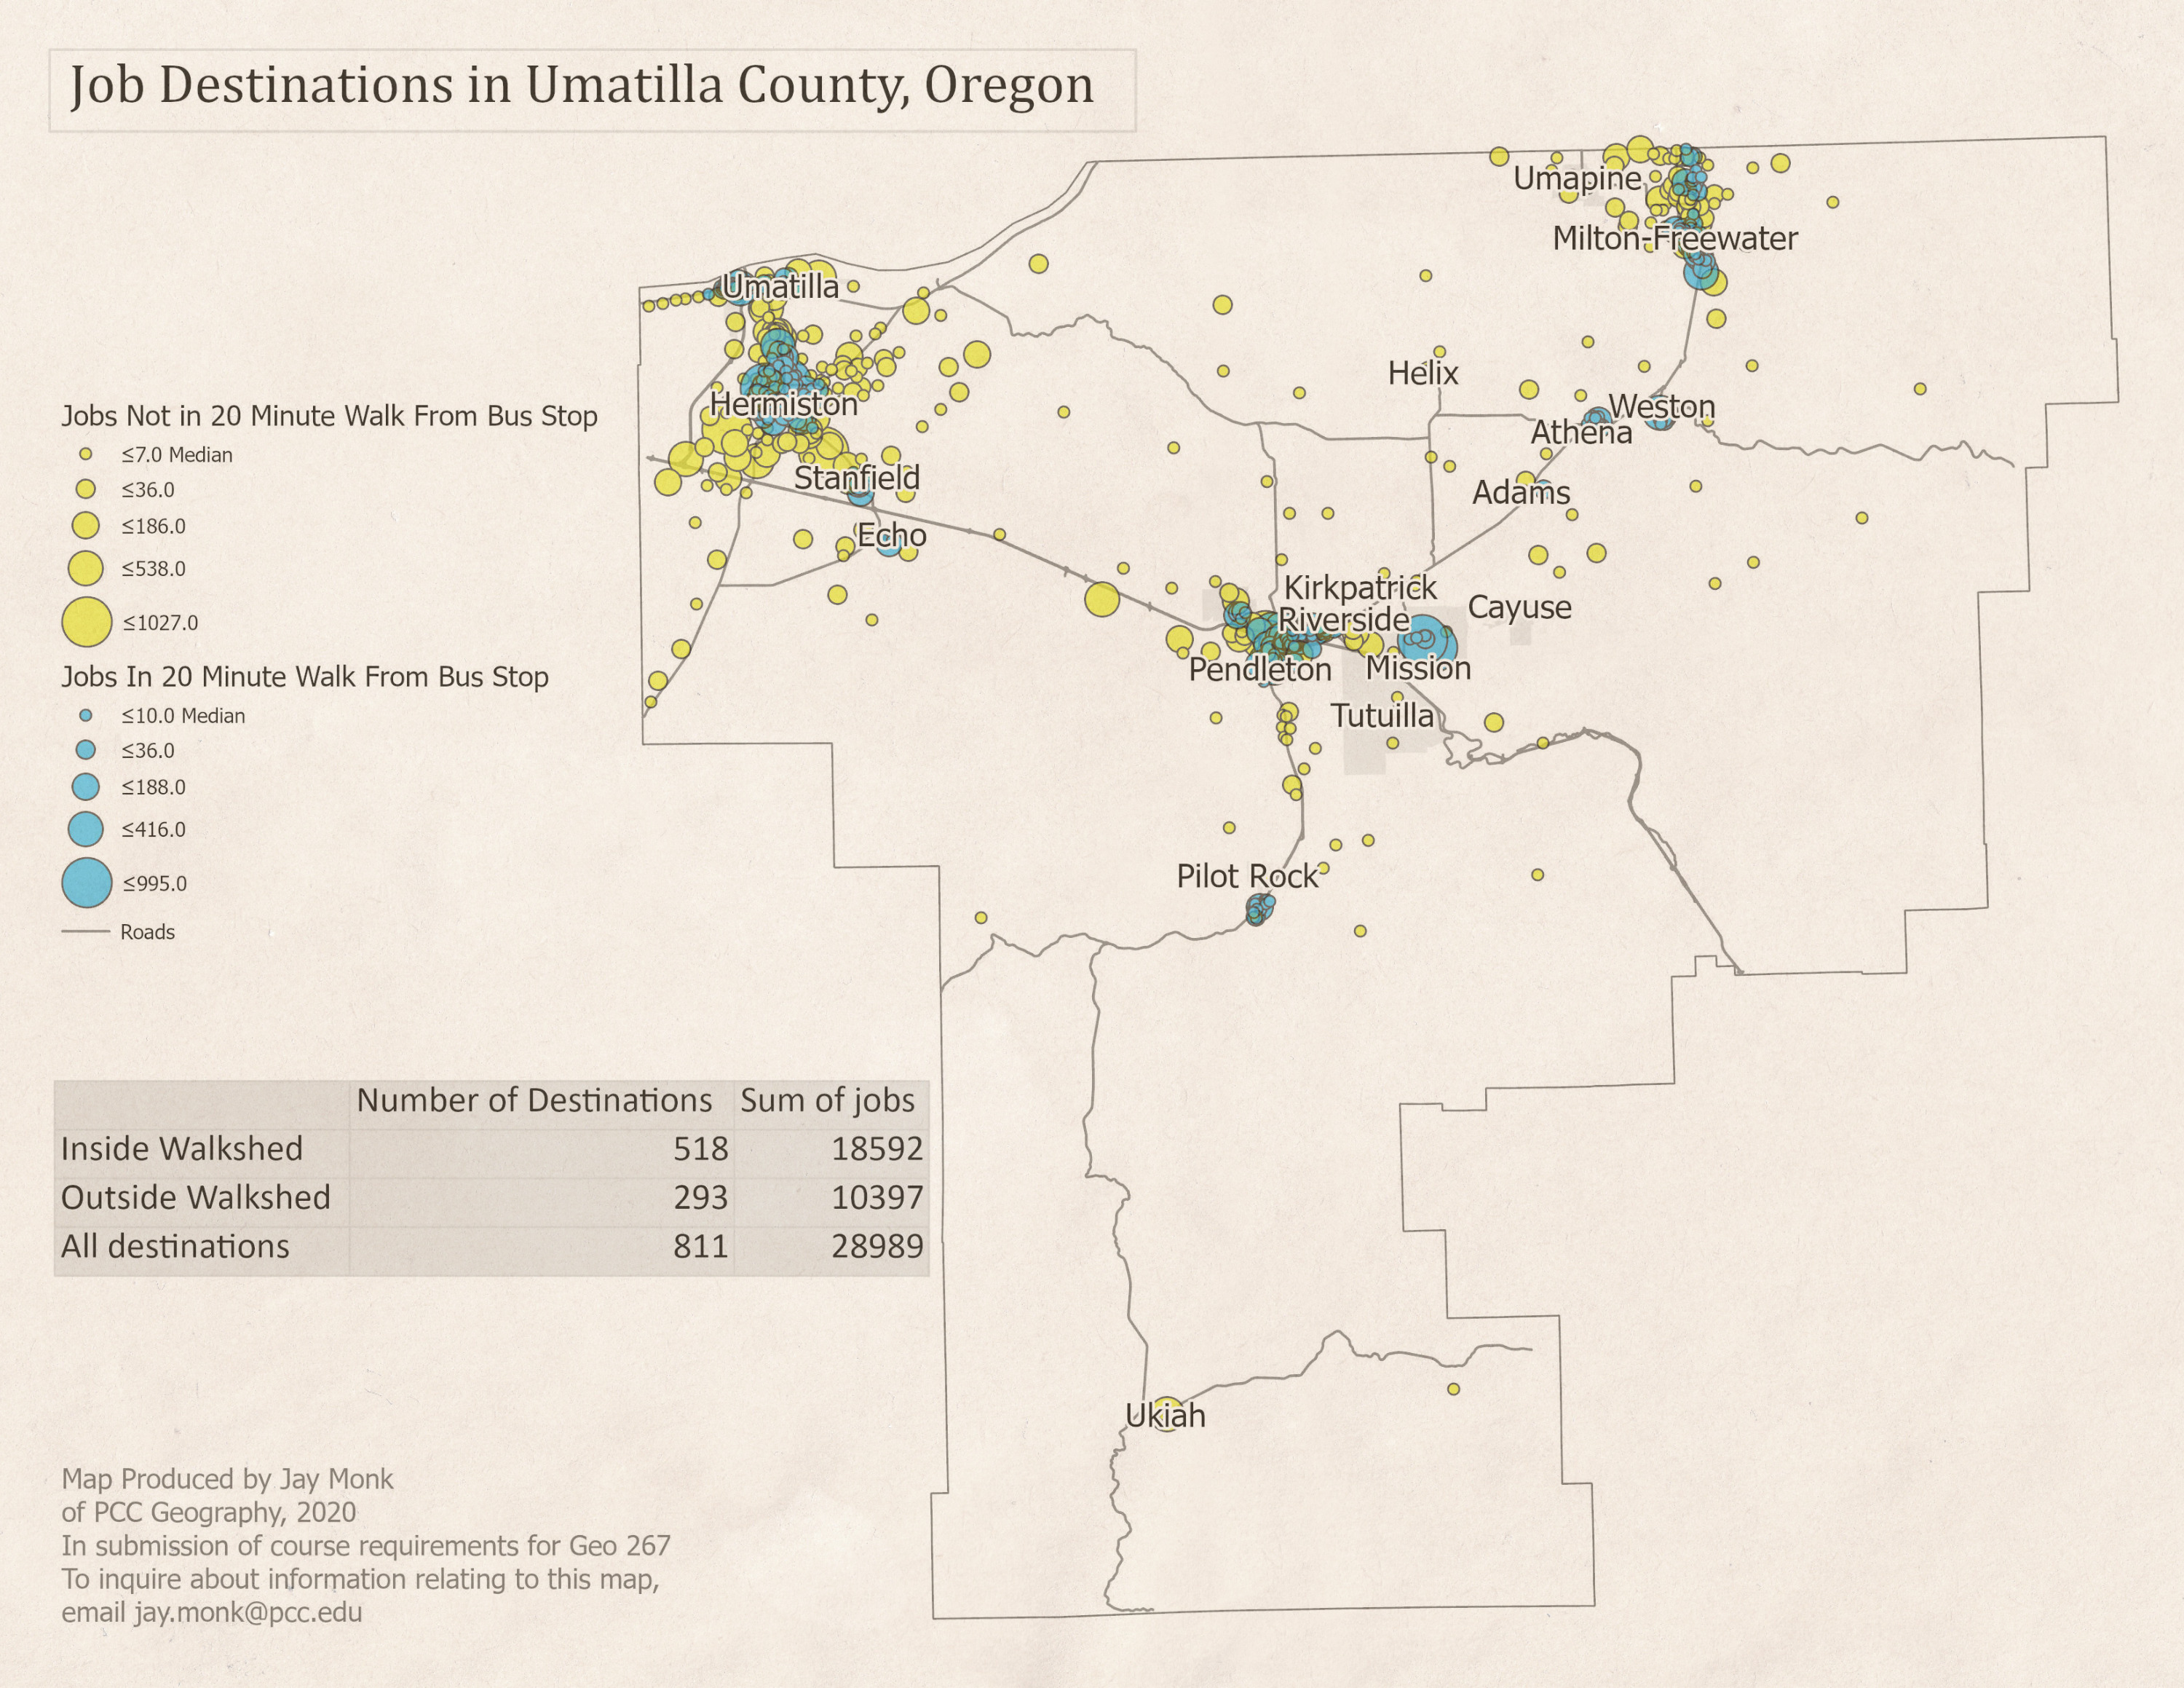
Using data from the Longitudinal Employer Household Dynamics survey, I found the distribution of job sites and employees working at those sites distributed across the county region. For more information on this survey, visit: https://lehd.ces.census.gov/
The LEHD layer was symbolized using graduated point sizes to indicate the number of jobs, and the color indicates inside (blue) or outside (yellow) of the walkshed area.
The inquiry into where were the jobs available within a reasonable walking distance from transit stops found the intersection of those job sites located within the walkshed polygon, and the inverse of jobs located outside the walkshed. I used spatial joins on both the walkshed product and the LEHD jobs points, which allowed me to symbolize the job sites based on their presence within or outside of the walkshed. Each walkshed had the number of jobs located within it added as a summary attribute to that shape, and this was summed up for the map on Job Destinations.

03
Hermiston Area, Local Cluster A
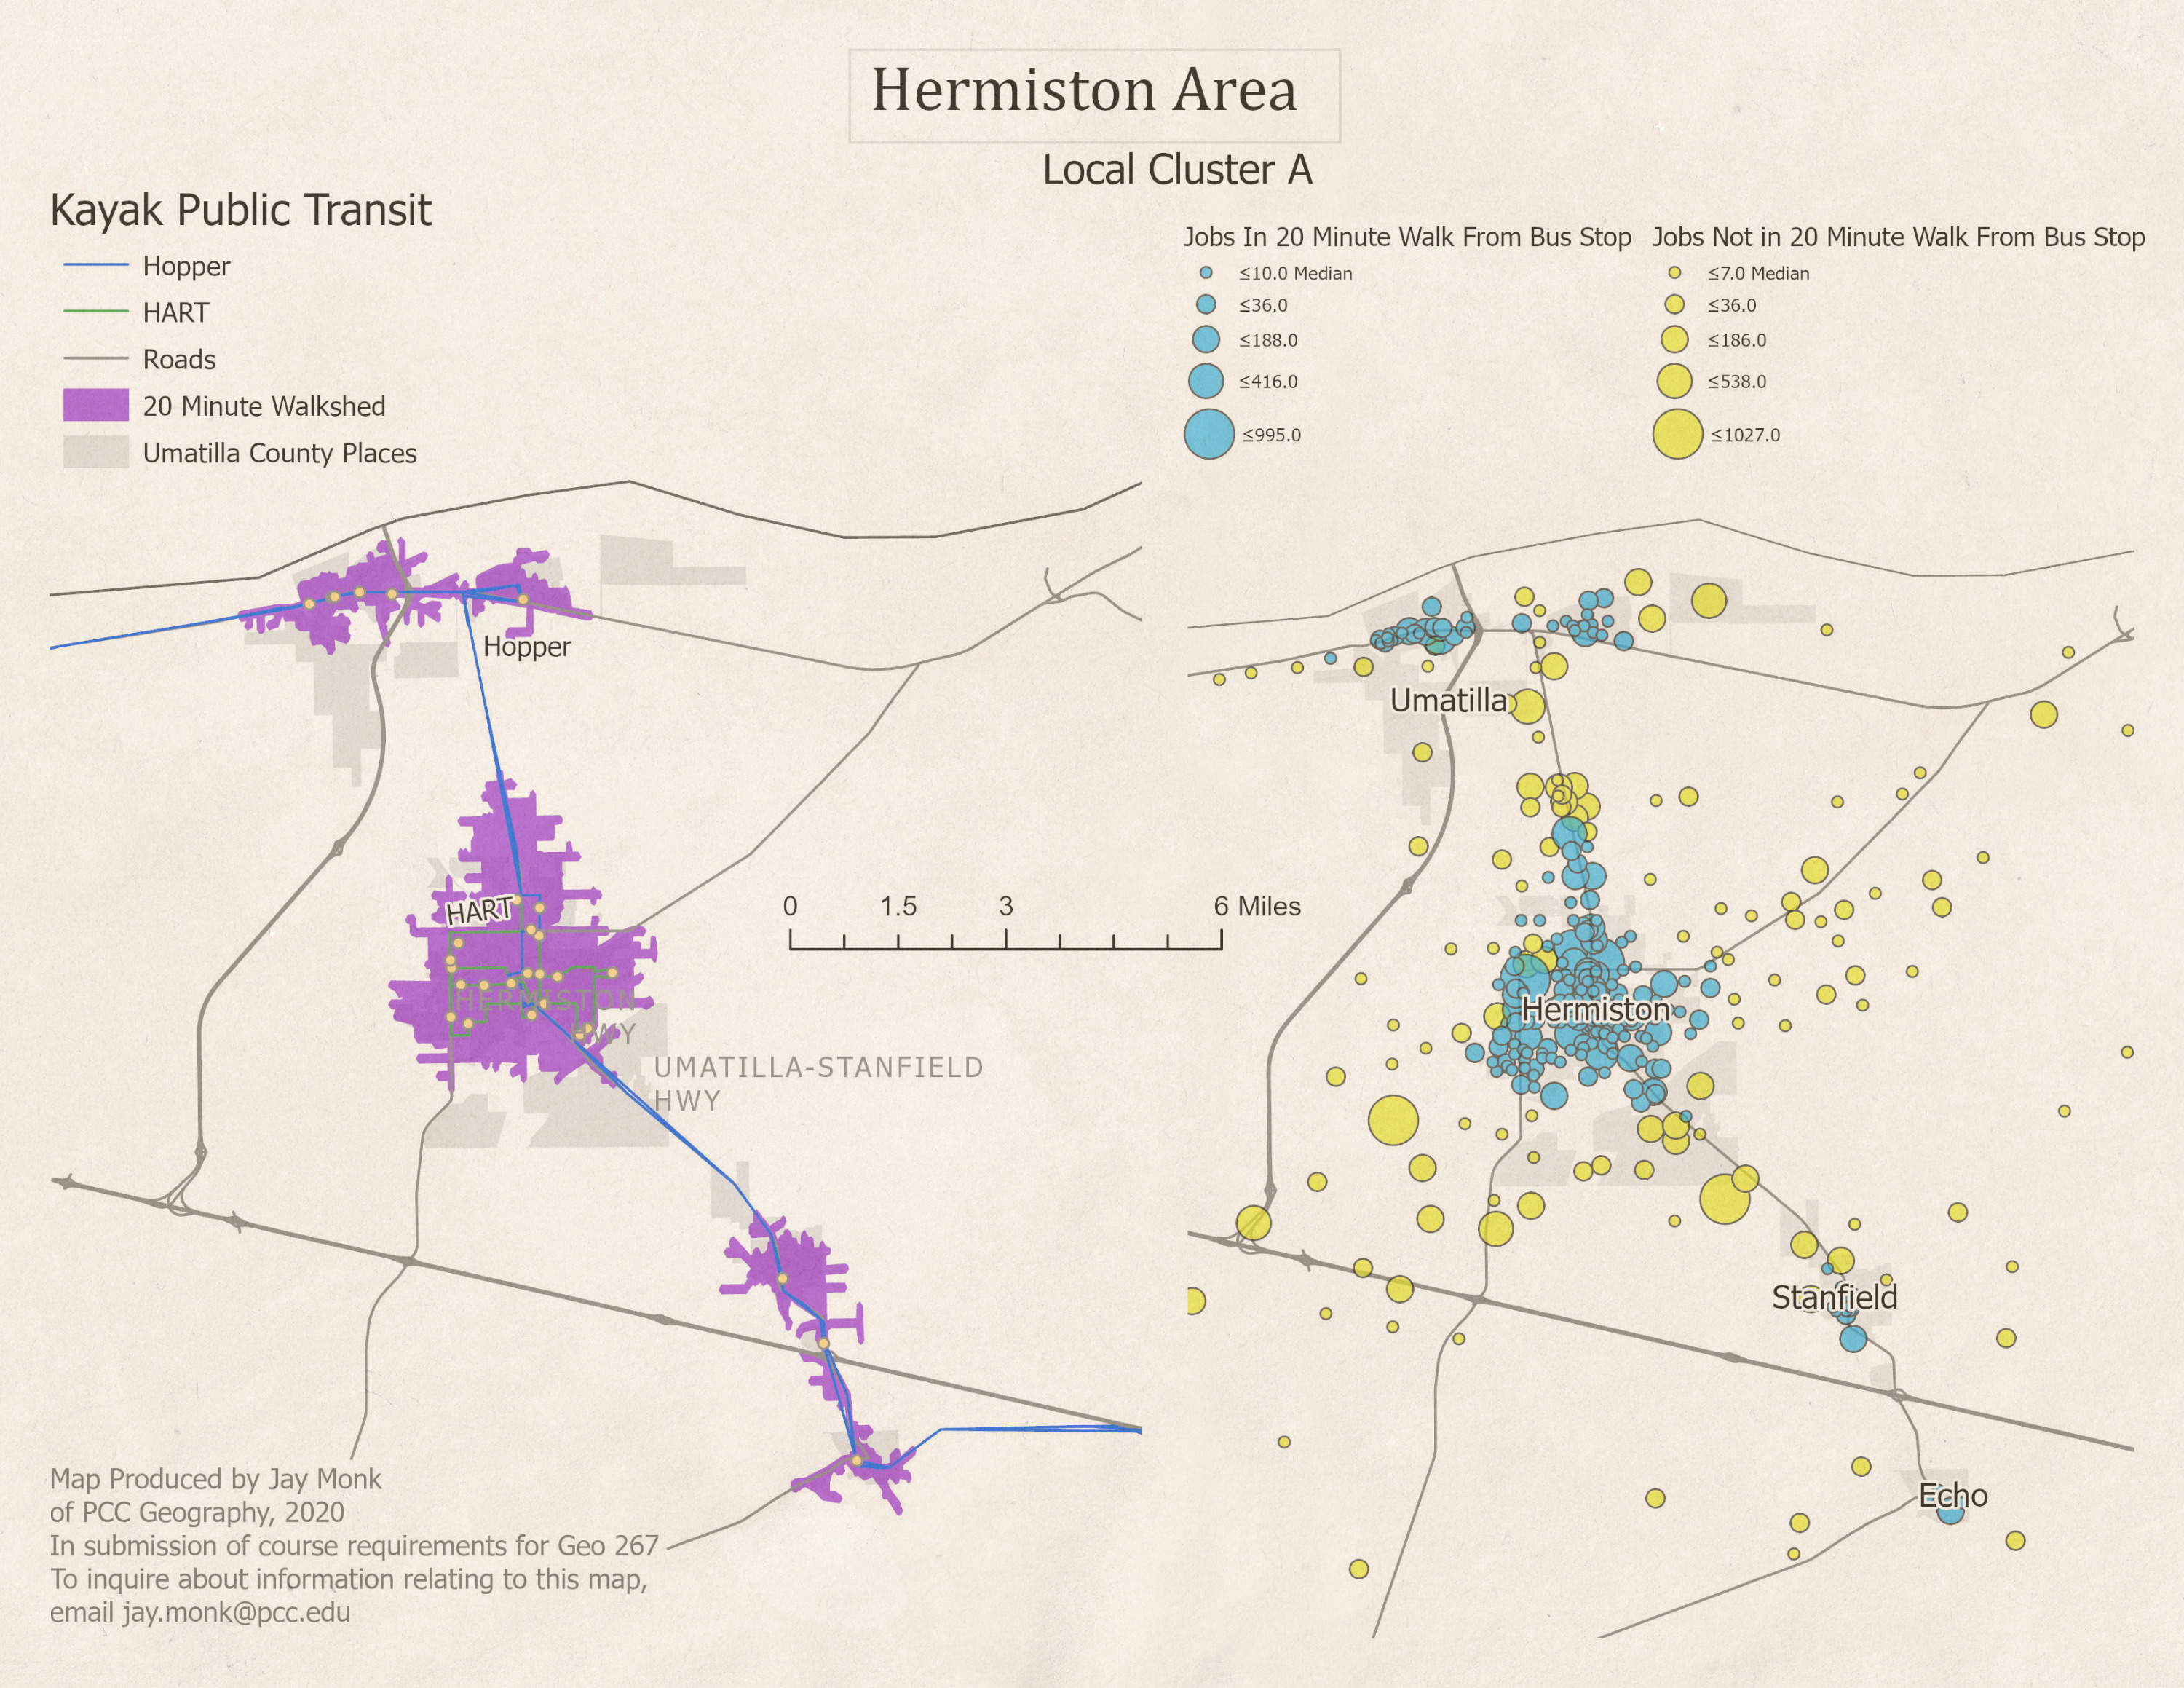
On the overview map, this area is indicated by Local Cluster A. The Hermiston area walkshed shows the greatest distance an average, able bodied person could travel on foot within 20 minutes from a Kayak Public Transit stop.

04
Pendleton area and Umatilla Tribal Reservation, CTUIR
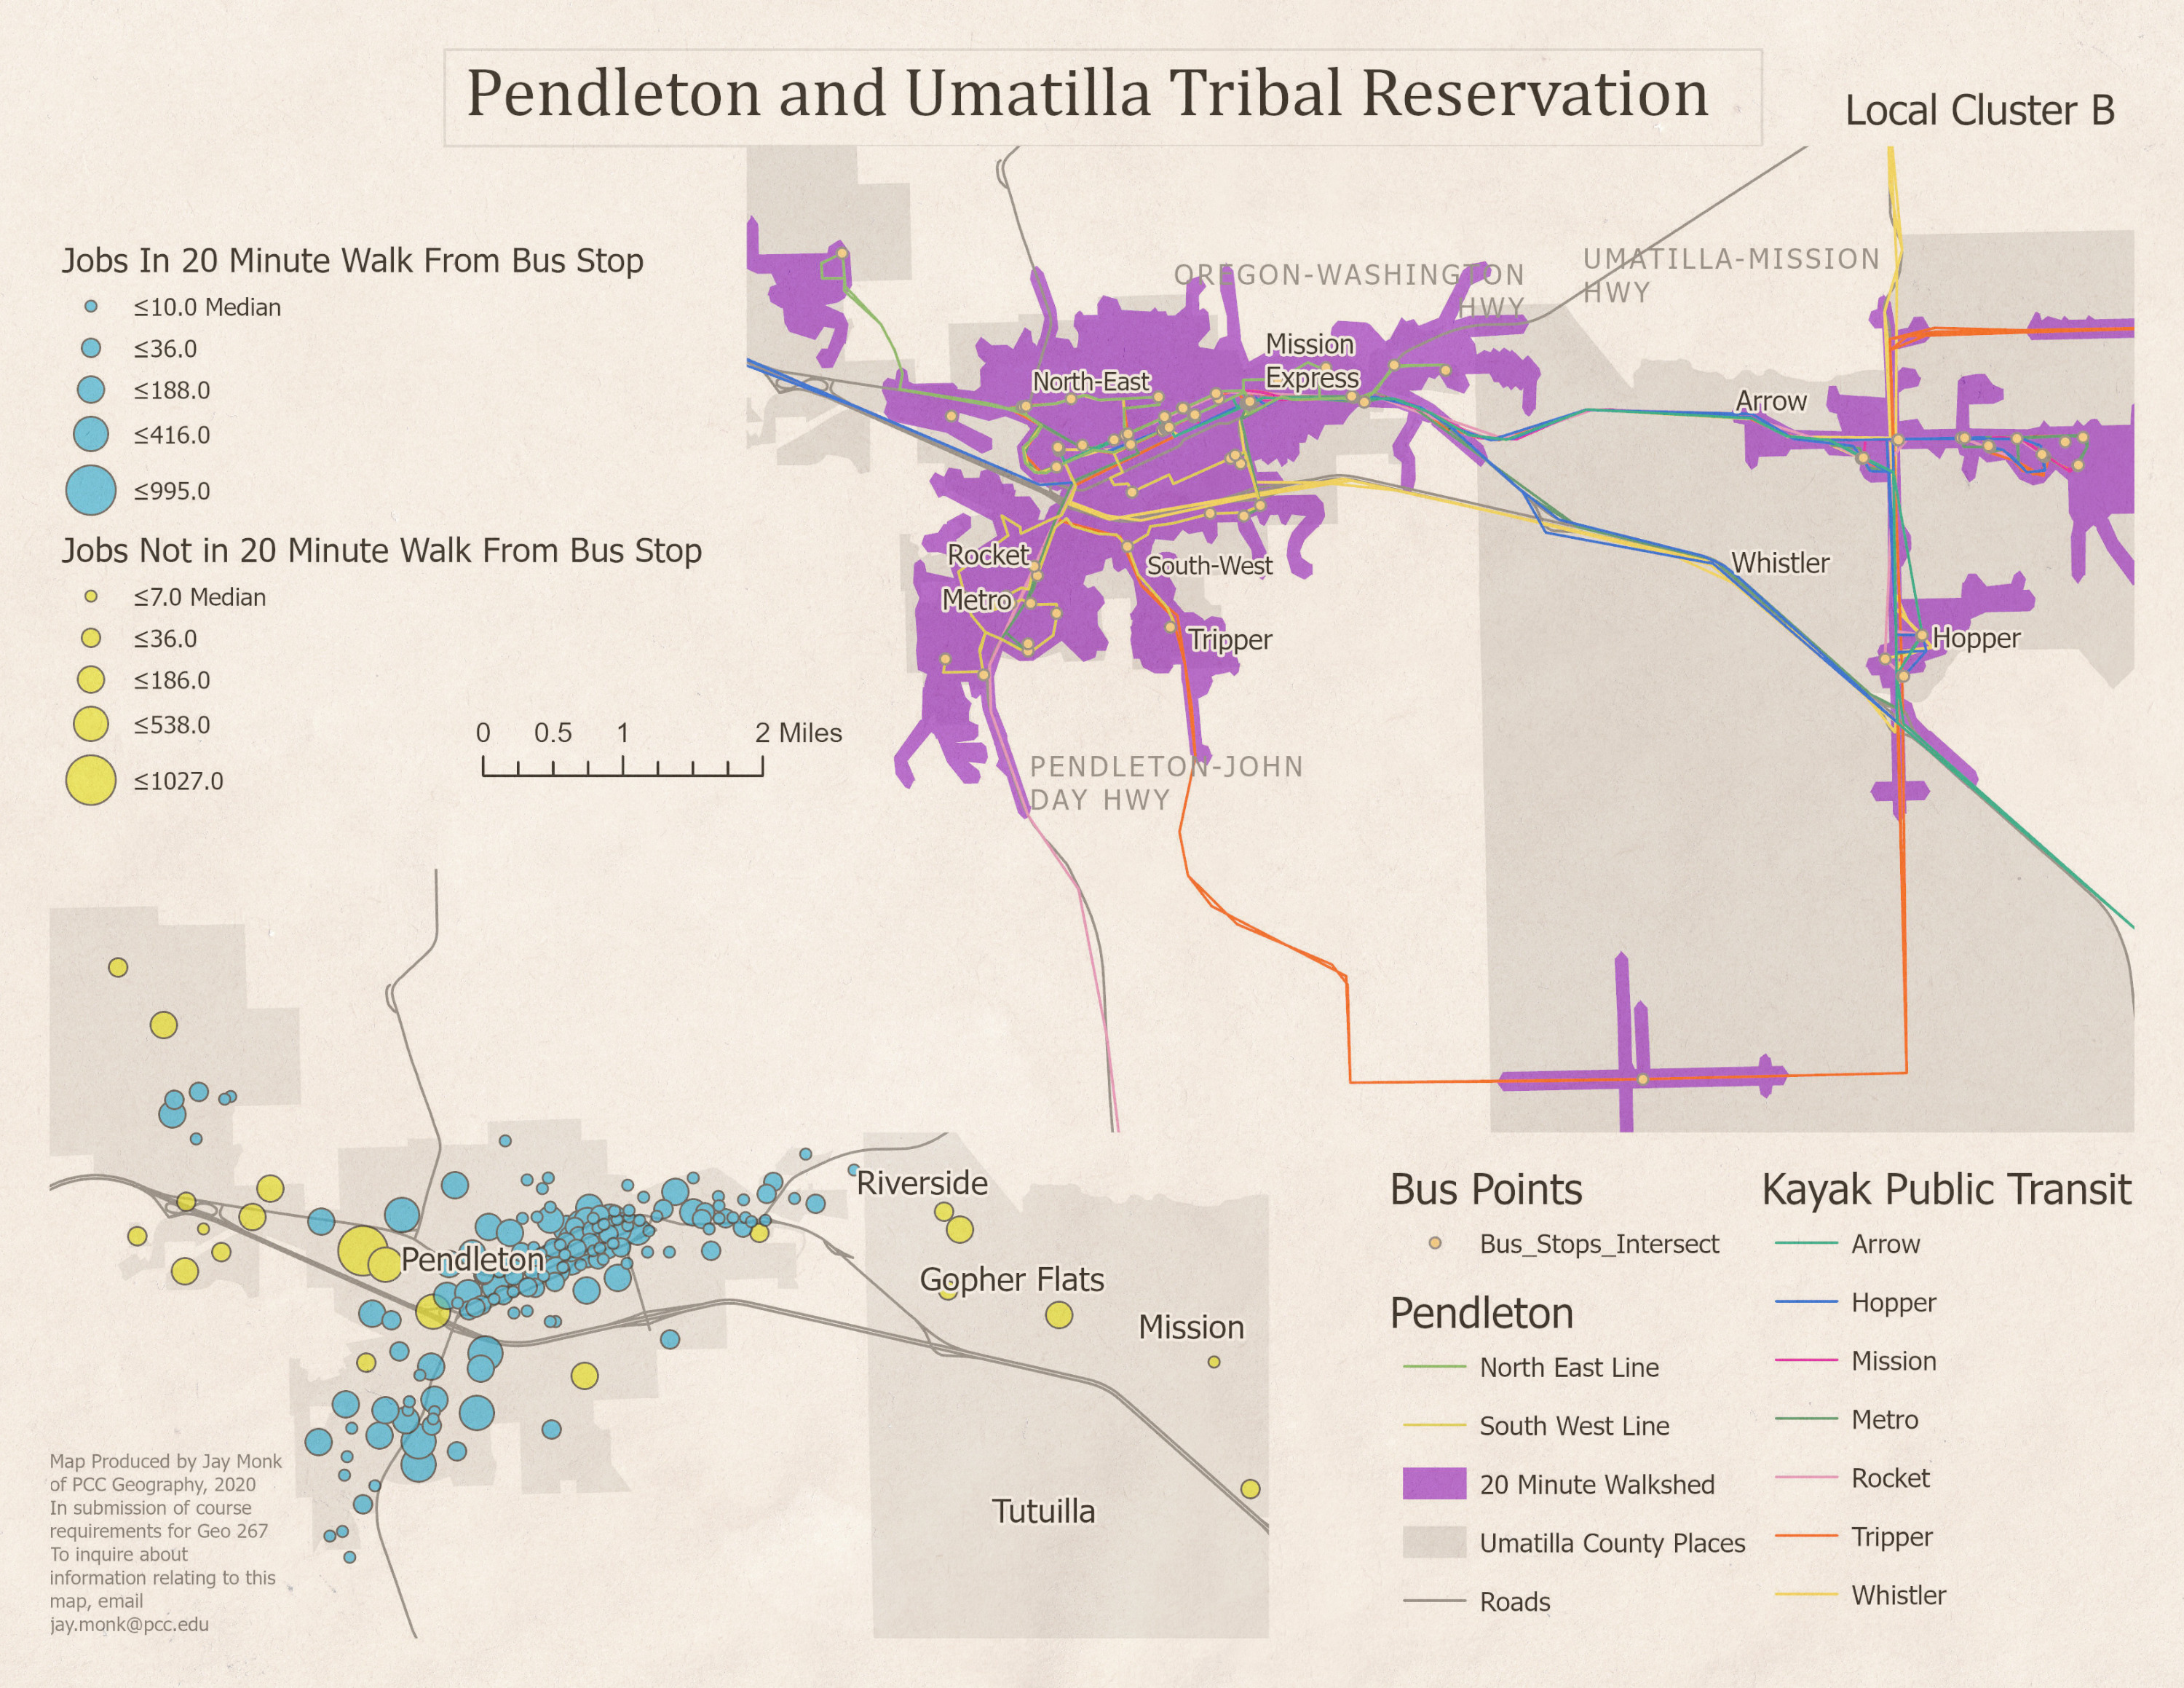
This map is shown as local cluster B in the map series. The cluster was defined by the Census Designated Place and what rural places fit on the appropriate map scale in this region. Kayak Public Transit was the most developed transit servicer in the region, connecting the surrounding rural community with multiple town centers.

05
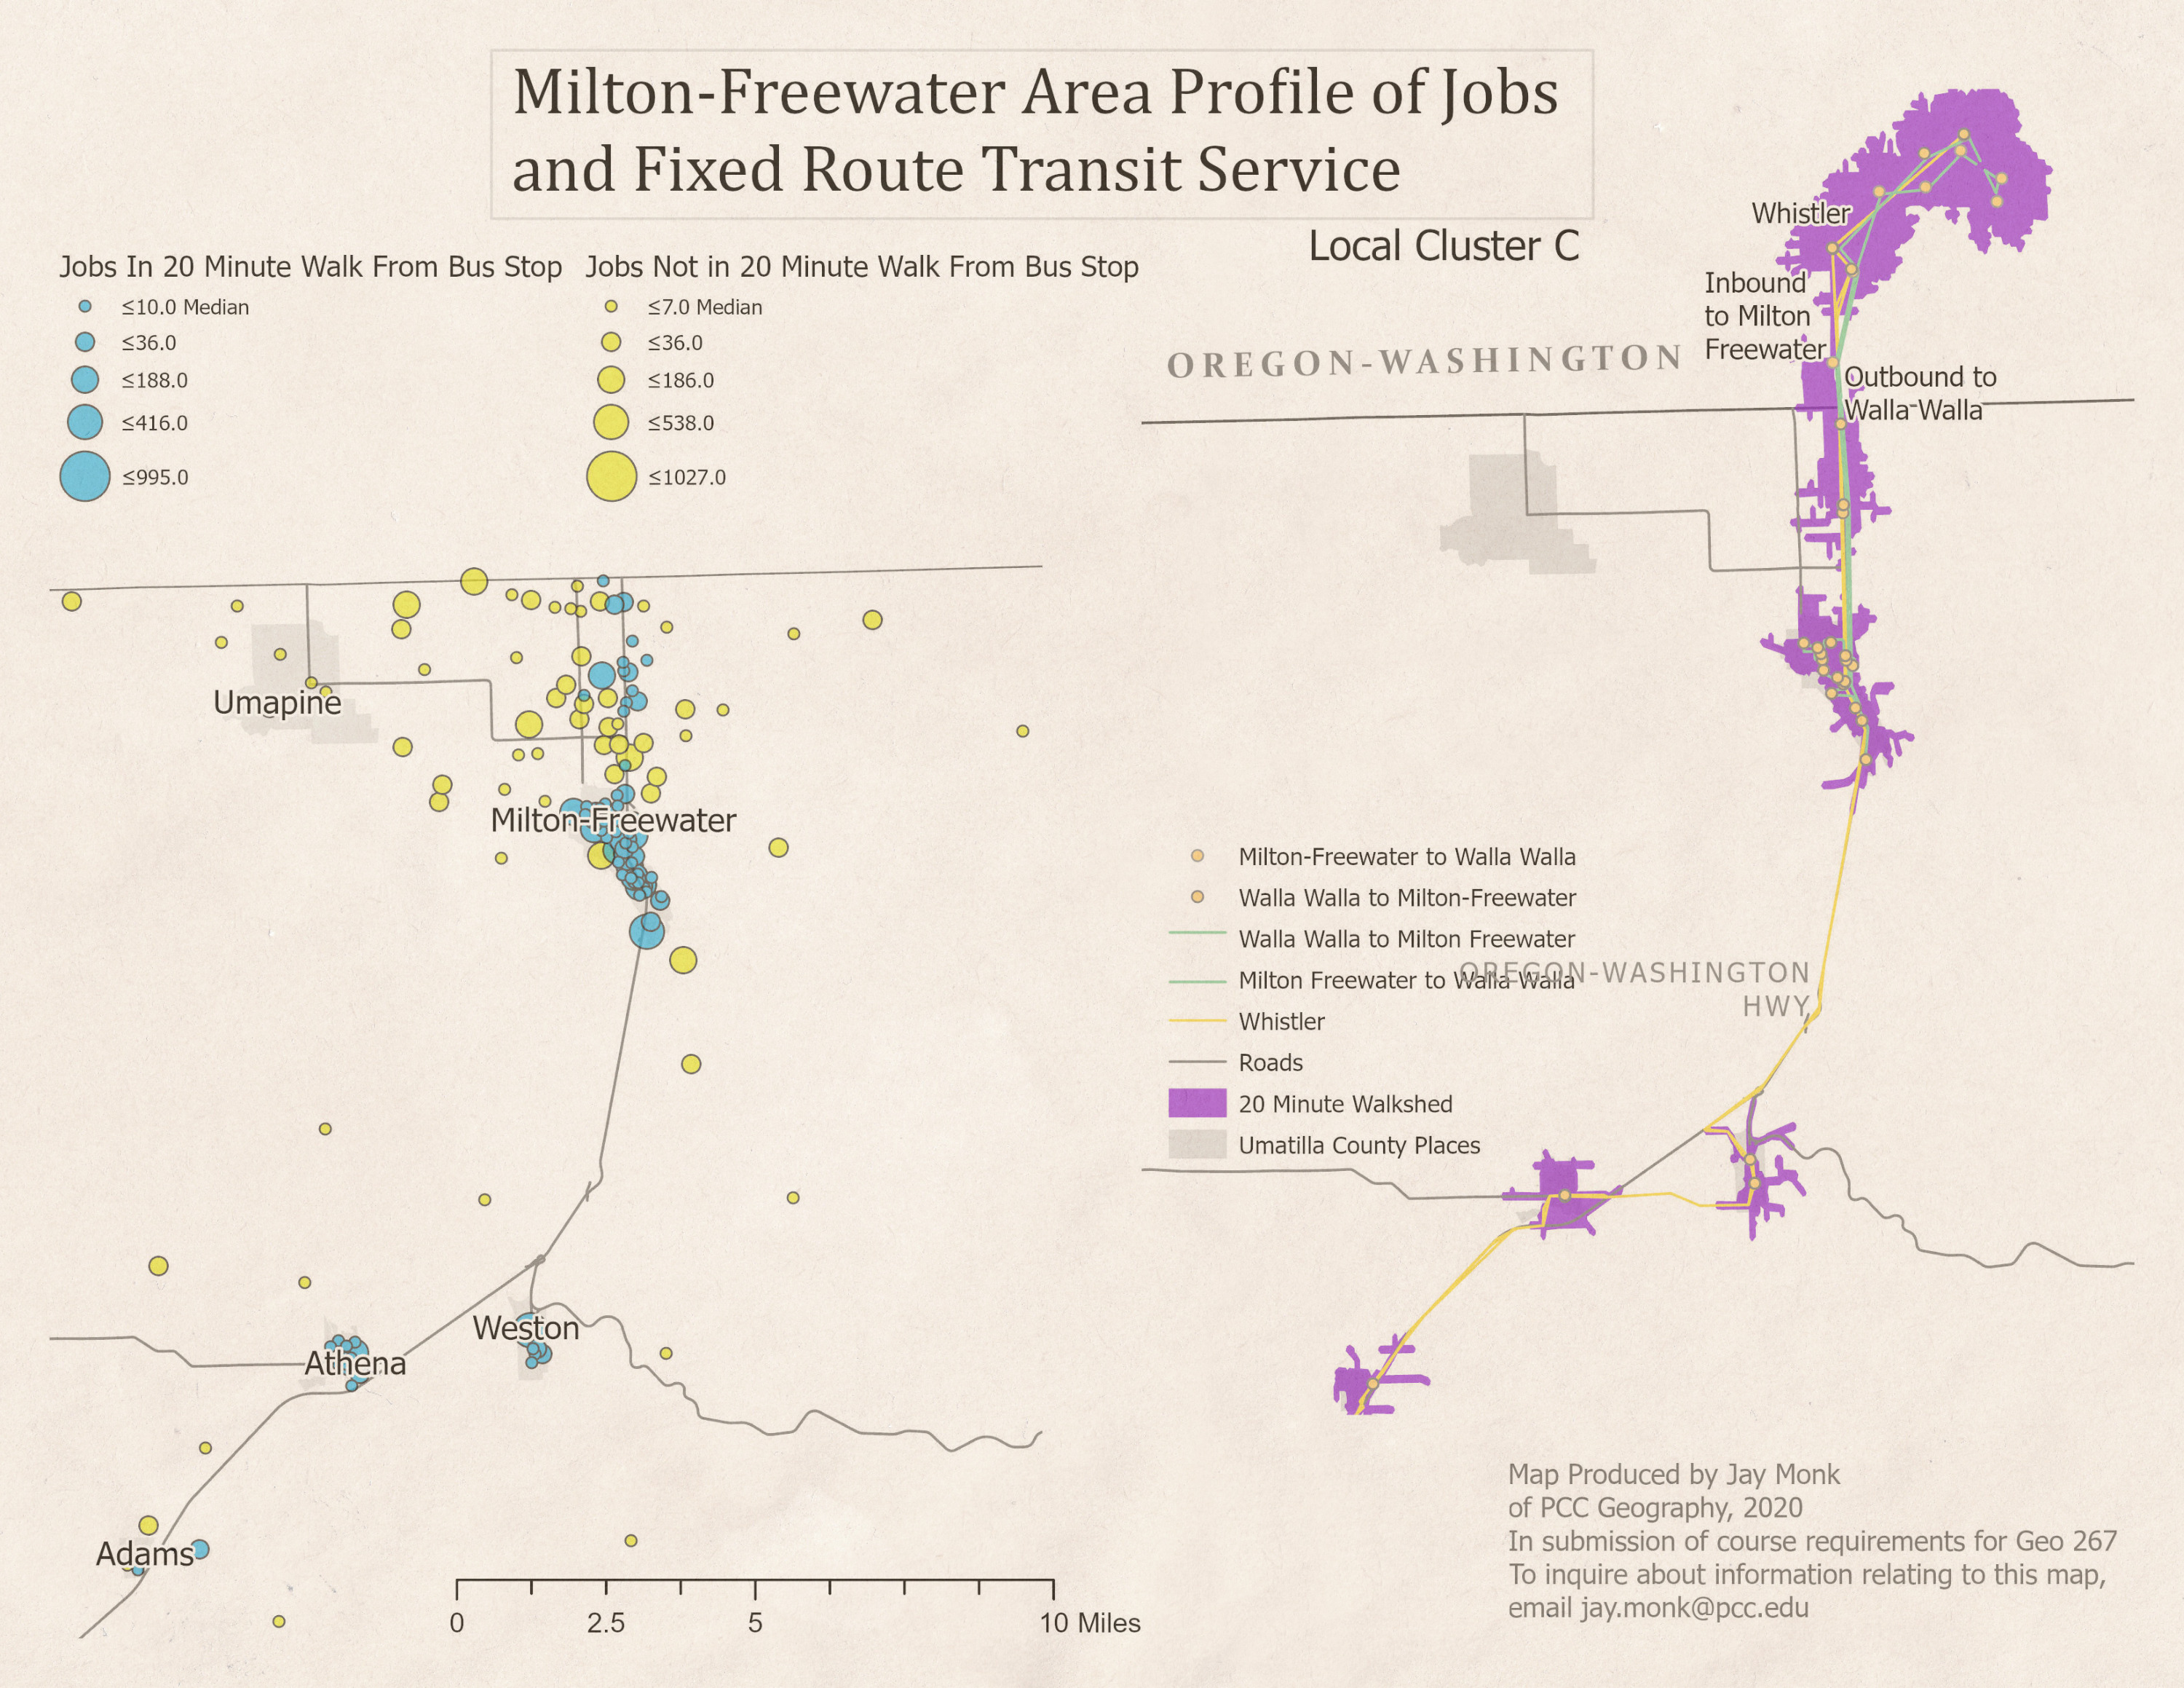
Milton-Freewater Area
Transit in Milton-Freewater region, as shown by local cluster C had the most geographic spread of any of the geographies I studied. They were also the only transit provider to cross into Washington, with connection to the Tri-Cities region. Though the Tri-Cities were modeled for the walkshed, the jobs data I used excluded the job destinations found outside of Umatilla County.

06
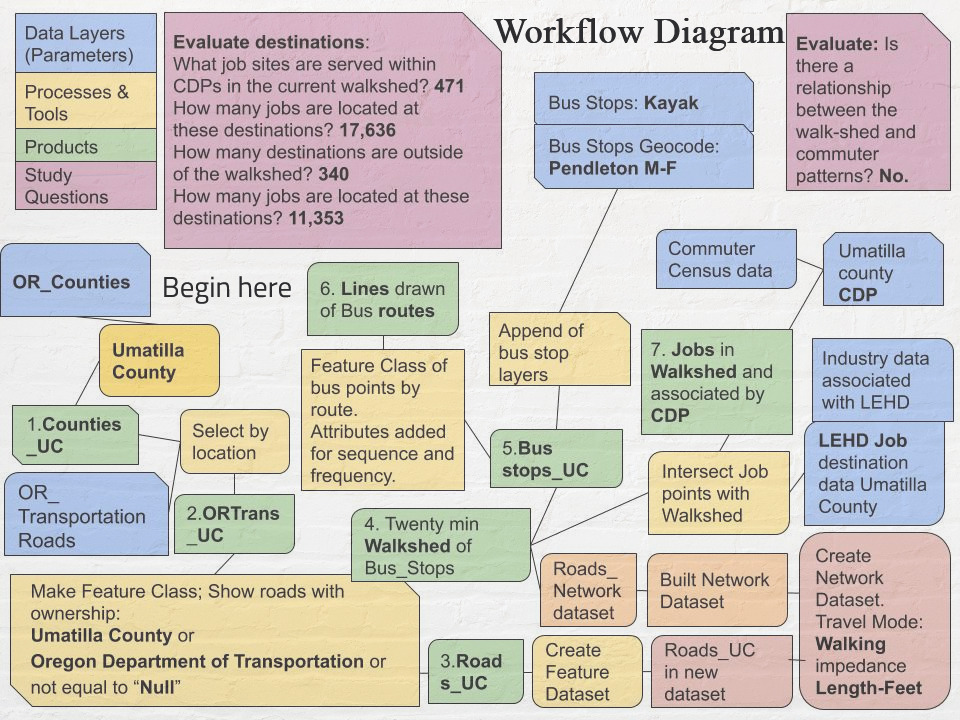
Workflow Diagram
01 / 06
Umatilla County Transit Routes
Capstone project for my GIS certificate at Portland Community College. Produced in 2020, in partnership with the Oregon Environmental Council. These maps show the intersection of two analyses: a Network Walkshed Analysis on 20 minutes walking time from transit stops and a Spatial Proximity Analysis on job locations. For these analyses, I used the county limits of Umatilla to define the whole area of interest, and Census Designated Places (CDPs) to define the “inside” and “outside” of the walkshed and spatial analysis parameters. The overall purpose for these analyses was to inquire into the topic of study for my project non-profit partner, The Oregon Environmental Council, studying the question: Where are the jobs within a 20-minute walking time of a bus stop, in Umatilla County?
The data for this analysis was current as of 2020.
01
Umatilla County Transit Routes
Capstone project for my GIS certificate at Portland Community College. Produced in 2020, in partnership with the Oregon Environmental Council. These maps show the intersection of two analyses: a Network Walkshed Analysis on 20 minutes walking time from transit stops and a Spatial Proximity Analysis on job locations. For these analyses, I used the county limits of Umatilla to define the whole area of interest, and Census Designated Places (CDPs) to define the “inside” and “outside” of the walkshed and spatial analysis parameters. The overall purpose for these analyses was to inquire into the topic of study for my project non-profit partner, The Oregon Environmental Council, studying the question: Where are the jobs within a 20-minute walking time of a bus stop, in Umatilla County?
The data for this analysis was current as of 2020.
02
Job Destinations in Umatilla County, Oregon
Using data from the Longitudinal Employer Household Dynamics survey, I found the distribution of job sites and employees working at those sites distributed across the county region. For more information on this survey, visit: https://lehd.ces.census.gov/
The LEHD layer was symbolized using graduated point sizes to indicate the number of jobs, and the color indicates inside (blue) or outside (yellow) of the walkshed area.
The inquiry into where were the jobs available within a reasonable walking distance from transit stops found the intersection of those job sites located within the walkshed polygon, and the inverse of jobs located outside the walkshed. I used spatial joins on both the walkshed product and the LEHD jobs points, which allowed me to symbolize the job sites based on their presence within or outside of the walkshed. Each walkshed had the number of jobs located within it added as a summary attribute to that shape, and this was summed up for the map on Job Destinations.
03
Hermiston Area, Local Cluster A
On the overview map, this area is indicated by Local Cluster A. The Hermiston area walkshed shows the greatest distance an average, able bodied person could travel on foot within 20 minutes from a Kayak Public Transit stop.
04
Pendleton area and Umatilla Tribal Reservation, CTUIR
This map is shown as local cluster B in the map series. The cluster was defined by the Census Designated Place and what rural places fit on the appropriate map scale in this region. Kayak Public Transit was the most developed transit servicer in the region, connecting the surrounding rural community with multiple town centers.
05
Milton-Freewater Area
Transit in Milton-Freewater region, as shown by local cluster C had the most geographic spread of any of the geographies I studied. They were also the only transit provider to cross into Washington, with connection to the Tri-Cities region. Though the Tri-Cities were modeled for the walkshed, the jobs data I used excluded the job destinations found outside of Umatilla County.
06
Workflow Diagram
- Capstone project for my GIS certificate at Portland Community College. Produced in 2020, in partnership with the Oregon Environmental Council. These project maps show the intersection of two analyses: a Network Walkshed Analysis on 20 minutes walking time from transit stops and a Spatial Proximity Analysis on job locations. For both analyses, I used a boundary of Umatilla County to define the whole area of interest, and Census Designated Places (CDPs) to contain the “inside” and “outside” of the walkshed and spatial analysis parameters. The overall purpose for these analyses was to inquire into the topic of study for my project non-profit partner, The Oregon Environmental Council, studying the question: Where are the jobs within a 20-minute walking time of a bus stop, in Umatilla County? The transit and transportation network data for this analysis was current as of 2020.
- Using data from the Longitudinal Employer Household Dynamics survey, I found the distribution of job sites and employees working at those sites distributed across the county region. For more information on this survey, visit: https://lehd.ces.census.gov/ The LEHD layer was symbolized using graduated point sizes to indicate the number of jobs, and the color indicates inside (blue) or outside (yellow) of the walkshed area. The inquiry into where were the jobs available within a reasonable walking distance from transit stops found the intersection of those job sites located within the walkshed polygon, and the inverse of jobs located outside the walkshed. I used spatial joins on both the walkshed product and the LEHD jobs points, which allowed me to symbolize the job sites based on their presence within or outside of the walkshed. Each walkshed had the number of jobs located within it added as a summary attribute to that shape, and this was summed up for the map on Job Destinations.
- On the overview map, this area is indicated by Local Cluster A. The Hermiston area walkshed shows the greatest distance an average, able bodied person could travel on foot within 20 minutes from a Kayak Public Transit stop.
- This map is shown as local cluster B in the map series. The cluster was defined by the Census Designated Place and what rural places fit on the appropriate map scale in this region. Kayak Public Transit was the most developed transit servicer in the region, connecting the surrounding rural community with multiple town centers.
- Transit in Milton-Freewater region, as shown by local cluster C had the most geographic spread of any of the geographies I studied. They were also the only transit provider to cross into Washington, with connection to the Tri-Cities region. Though the Tri-Cities were modeled for the walkshed, the jobs data I used excluded the job destinations found outside of Umatilla County.
bottom of page